Proc. of Second World Avocado Congress 1992 pp. 579-583
Irrigation and Fertilization Management of Avocados: Economic Analysis Progress Report
Etaferahu Takele,
Jewell L. Meyer, David E. Stottlemyer, and Marylynn V. Yates
Department of Soil and Environmental Sciences, University of
California, Riverside, CA 92521, USA
Mary L. Arpaia
Department of Botany and Plant Sciences, University of California, Riverside, CA 92521, USA
Gary S. Bender
Cooperative Extension, University of California, Building 4, 5555 Overland Avenue, San Diego, CA 92123, USA
Guy W. Witney
Cooperative Extension, University of California, 21150 Box
Springs Road, Moreno Valley, CA 92387, USA
Abstract. The effect of integrated applications
of various rates of irrigation and fertilization on productivity of the 'Hass' avocado (Persea americana Mill.) has been
analyzed since 1987. The resulting data were used in a partial budgeting analysis to determine the optimum combination
of irrigation and fertilization that maximize returns using various water cost
scenarios. This is an ongoing
project and to date the 100 percent ETc has been identified to be the optimal
irrigation level. Neither the substitution of fertilizer for reduced water use
nor the combination of high levels of fertilizer and water was found to be
maximizing returns.
Water costs to avocado growers have increased significantly in most Southern California production areas. Furthermore, the increasing urban demand for water has created concern about further water cost increases and reduced profit in agriculture. Some growers have been toying with the idea of minimizing costs through supplementation of fertilizer for reduced use of water or maximizing productivity and returns through increased use of both fertilization and water. However, neither the relationship of yield to evapotranspiration (ET) nor the interrelationship of fertilizer and water use in avocado production are understood well enough to support the suggested economic implications.
Previous studies have shown the effect of fertilization on 'Hass' productivity. From experiments in San Diego and Ventura counties with variable nitrogen applications, yields of 'Hass' variety appear to be less sensitive than yields of 'Fuerte'. On the other hand, the evidence did not indicate that a high level of nitrogen nutrition will reduce yields of the 'Hass' as it did with the 'Fuerte' variety (Embleton et al., 1968).
A comparison of sprinkler versus drip irrigation on the
effect of tree canopy size and trunk circumference in San Diego county showed
significant differences in tree measurements between varieties. Differences
were insignificant between irrigation methods (Gustafson, et al.
1979). Furthermore, a comparison in evaporation loss between the
sprinkler and drip irrigation showed a water saving of 24% to 69% by the drip
over the sprinkler system. Although, it is understood that the drip system
requires more labor and management for frequent check up and control of the
system, the estimated savings exceeded the expenses (G. Benoit, unpublished).
This paper analyzes the effect of integrated applications of low volume irrigation (drip system) with nitrogen and zinc fertilization on 'Hass' avocados. The objective is to determine the optimum combination of irrigation and fertilizer that maximizes returns using various water cost scenarios. The economic analysis commenced in June, 1989, and continued in 1990. The analysis involved a partial budgeting process estimating the costs of treatments and returns of several integrations.
Materials
and Methods
An experiment using a randomized complete block design for irrigation with nitrogen and zinc as split plots started on mature (8 years) 'Hass' (Persea americana Mill.) avocado trees in 1987 in the Riverside county. The analysis included determining the relationship between the amount of water application using low volume irrigation (a drip system), fertility, root distribution, and productivity. Three irrigation, three nitrogen and two zinc treatments were involved, making up 18 different combinations referred to as trials. Each trial involved 11 trees. For simplicity's sake, the trials are referred to as numbers 1 to 18. The exact combination for each trial is shown in Table 1.
ETo (reference ET) is determined daily at DC
Riverside and other local weather stations. Crop water use, ETc, is determined
weekly using the equation ETc = ETo x Kc. The crop coefficients, Kc, were
determined from 1987 to 1990 with 100 percent ETc, based upon soil matrix
potential not exceeding 30 kPa in the soil root zone of 12 to 45 cm. The range
of water application averaged 24 ha cm for the 80 percent ETc, 28 ha cm for the
100 percent ETc, and 32 ha cm for the 120 percent ETc per annum per hectare.
Nitrogen applications included 0.16 kg for NO, 0.7 kg for N1, and 1.4 kg for N2
per tree per year. Zinc applications were 0.0 kg for ZO and 0.02 kg for Z1 per
tree per year.
Each year the harvest was graded according to packing-house standards. A large sample (close to 50% of the crop in both 1989 and 1990) of fruit from each tree was counted, weighed and classified by size group. Then, the total crop was classified according to the sample data. Per trial data were then converted into per hectare basis.
|
Table 1. Irrigation, nitrogen, and zinc
combinations for 18 trials. |
|||
|
Trial |
Irrigation
(% ETc) |
Nitrogenz |
Zincy |
|
1 |
80 |
NO |
ZO |
|
2 |
80 |
NO |
Z1 |
|
3 |
80 |
N1 |
ZO |
|
4 |
80 |
N1 |
Z1 |
|
5 |
80 |
N2 |
ZO |
|
6 |
80 |
N2 |
Z1 |
|
7 |
100 |
NO |
ZO |
|
8 |
100 |
NO |
Z1 |
|
9 |
100 |
N1 |
ZO |
|
10 |
100 |
N1 |
Z1 |
|
11 |
100 |
N2 |
ZO |
|
12 |
100 |
N2 |
Z1 |
|
13 |
120 |
NO |
ZO |
|
14 |
120 |
NO |
Z1 |
|
15 |
120 |
N1 |
ZO |
|
16 |
120 |
N1 |
Z1 |
|
17 |
120 |
N2 |
ZO |
|
18 |
120 |
N2 |
Z1 |
|
z NO, N1 and N2 refer to
low, medium, and high levels of nitrogen application, respectively. y ZO and Z1 refer to with or without zinc
applications, respectively. |
|||
Our packing process has not included #2s or standards. We learned from previous records that the emphasis has been on size rather than grade, and very little of the crop has traditionally been classified #2s in the industry. Therefore, we did not concern ourselves in making grade distinctions.
The costs considered in this project included the material and application of water and fertilizer, harvesting, and marketing. Annual prices of nitrogen and zinc were used; however, water costs vary depending on elevation and location. In this study, impacts of various water charges (ranging from $12.50/ha cm and upward) were analyzed. Also included was interest on operating capital at 10%.
Harvesting and marketing costs are functions of yield; therefore they vary with the level of productivity. The harvesting charges of picking and hauling included the annual average of $US 0.13 and $US 0.04 per kg, respectively. The marketing costs included packing at $US0.15 cents per kg and the California Avocado Commission (CAC) assessments were calculated at 4% of the gross returns minus harvesting costs.
The gross returns for each trial were the sum of the product of the amount of fruit in each size category and the corresponding prices. Annual industry average prices for each size category were used. However, prices of avocados alter frequently with respect to sizes thus the relative gross return differences among the trials could vary from one time to the other. Because regional differences exist in bloom and harvest, future work will include gross returns evaluated using prices corresponding to local and regional harvesting periods.
The next procedure was to deduct the corresponding treatment costs from the gross returns of the trials. Then the remaining returns were used as a basis for comparison among treatments. It should be noted that this is a partial budget analysis, therefore the remaining returns are not net returns and are referred to as PNRs in the analysis.
Results and
Discussion
A tremendous yield variability is indicated among trials within a year, within trials from one year to the next, and among years. Because of the alternate bearing characteristic of avocados which implies that in any given year some trees will be naturally yielding well and some poorly, it will be difficult to distinguish the treatment effect in any single year. However, with data over several consecutive years, productivity differences effected by the alternate bearing characteristics will be minimized and the treatment effects will be expressed.
Figure 1 presents the annual and the overall yield of each trial. Trial 7 (100 percent irrigation with low level of nitrogen and no zinc application) led in productivity followed by trial 9 also in the 100 percent irrigation with medium level of nitrogen and no zinc application. Following is trial 15 in the 120 percent irrigation with medium level of nitrogen and no zinc application. The above individual results were also in accordance to the overall average. An increase in productivity of 16% was shown as the irrigation level increased from 80 percent ETc to the 100 percent ETc. Increased irrigation from 100 percent to 120 percent did not result in increased production. The yield averages by nitrogen application were just about the same for NO and N1. N2 showed reduction of yield. With respect to zinc, those without zinc (ZO) applications resulted in higher returns than those with zinc (Z1).
An indirect relationship between crop volume and size of crop has been observed. The 1989 crop, small in volume, leaned towards larger size. The bulk of the crop (56%) was sized 48s and above with 48s alone constituting 41% of the crop. The 1990 crop, however, larger in volume than the 1989 crop, was smaller in size with the bulk of the crop (70%) falling in the 60s and 70s categories. In both years, the proportion of the larger sizes increased with irrigation and nitrogen.
The gross returns analysis showed a lead by trial 7. Since gross returns is a factor of size distribution and the corresponding price variation, high yielding trials did not necessarily result in high returns. Thus, the ranking of trials in order of gross returns was found to be different than that of yield in some cases. Trial 15 which rated third highest in yield became second place in returns. This is attributed to the increased fruit size (and the corresponding high price) of more irrigation.
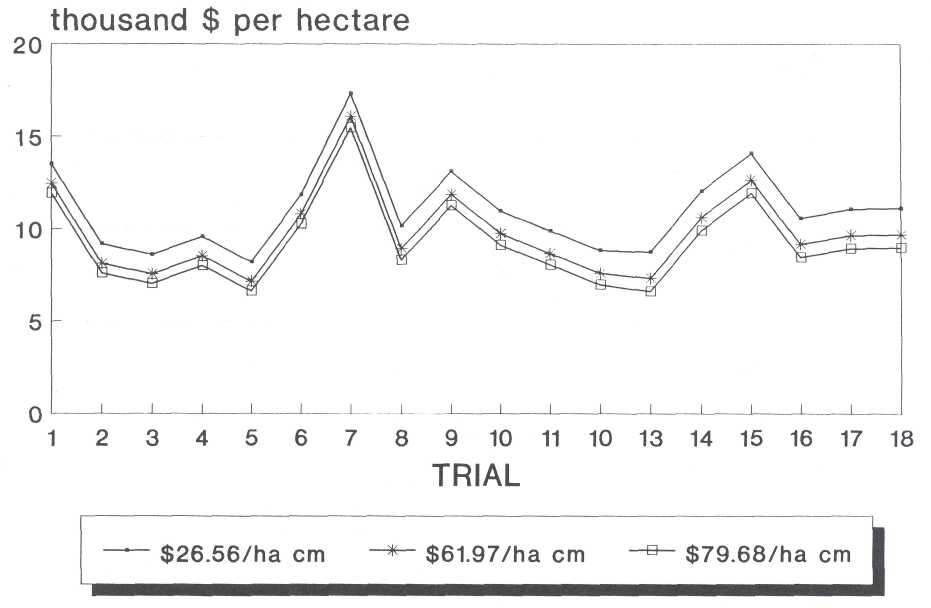
Finally, the average PNRs of the two years are
presented in Figure 2. The effects of increasing water price scenarios were
analyzed. The PNR results showed that trial 7 led even at very high water
prices. Trial 1 5 was rated second highest until the price of water reached
$80/ha cm, then it dropped to third highest. Trial 1 then moved up to second
highest. That means at water costs beyond $80/ha cm, trial 1 becomes cost
effective and provides more PNR than trial 15.
Conclusion
The analysis showed that 100% ETc has been found to be the optimum level of irrigation. Furthermore, neither the substitution of fertilizer for reduced water use, nor the combination of high level of water and fertilizer were found to maximize returns. However, because of the tremendous variability of the productivity of trees within the avocado grove from one year to the next, the conclusion should remain tentative until we get more data. We have one more year of funding left, but we are also requesting an extension by at least another year to 1992.
Literature
Cited
Embleton, T.W., and W.W. Jones. 1964. Avocado nutrition in California. Proc. Florida State Hort. Soc. 77:401-405.
Embleton, T.W., W.W. Jones, and M.J. Garber. 1959. Leaf analysis as a guide to nitrogen fertilization of avocado. Calif. Avocado Soc. Yrbk. 43:94-95.
Embleton, T.W., W.W. Jones, M.J. Garber, and S.B. Boswell. 1968. Nitrogen nutrition of the 'Hass' avocado. Calif. Avocado Soc. Yrbk. 52:131-134.
Gustafson, C.D., A.W. Marsh, R.L. Branson, and Sterling Davis. 1979. Drip irrigation on avocados. Calif. Avocado Soc. Yrbk. 63:95-134.
Jones, W.W., T.W. Embleton, and C.B. Cree. 1957. Number of replications and plot sizes required for reliable evaluation of nutritional studies and yield relationships with citrus and avocado. Proc. Amer. Soc. Hort. Sci. 69:208-216.
Marsh
A.W., R.L. Branson, S. Davis, C.D. Gustafson, and R.A. Strohman. 1978.
Irrigating new avocado orchards. California Agriculture 32:19-20.
Figure 1. Yield per trial, irrigation, and fertilization management of 'Hass' avocados.
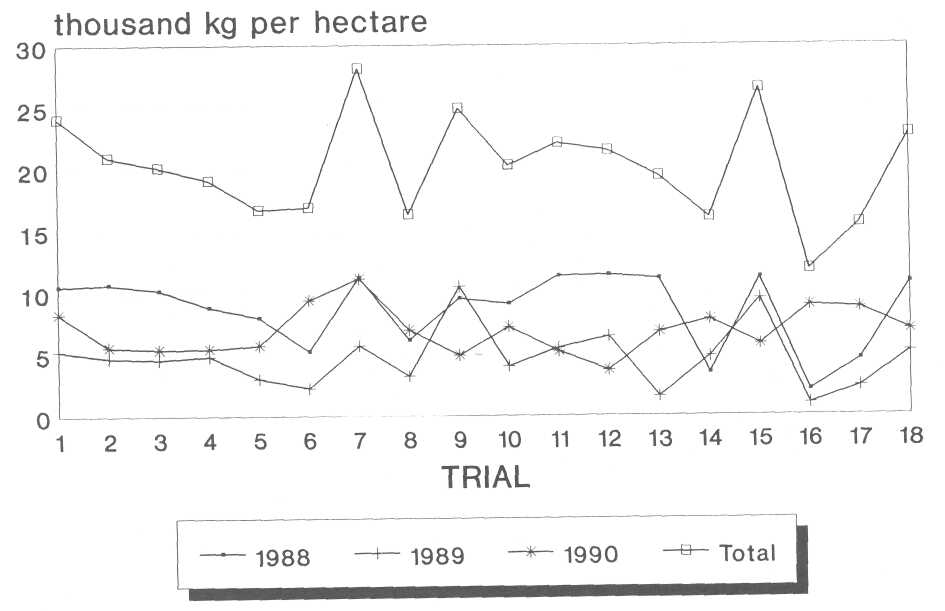
Figure 2. Partial net returns at various prices of water irrigation and fertilization management of "Hass1 avocados.