Proc. of Second World Avocado Congress 1992 pp. 395-402
Relationship between
Mineral Nutrition and Postharvest Fruit Disorders of 'Fuerte'
Avocados
S.F. du Plessis
and T.J. Koen
Citrus and Subtropical Fruit Research Institute, P/Bag
X11208, Nelspruit, 1200, Republic of South Africa
Abstract. The purpose of this investigation was to determine if
plant nutrition was in any way related to the development of post-harvest fruit
disorders in avocado such as gray pulp, pulp spot and vascular browning. Fruit
from three existing fertilizer experiments were cold stored at 5.5C for 31
days, ripened at 21C for 3 days and then evaluated for these disorders. The
incidence of these disorders was related to soil, leaf and fruit nutrient
analysis by means of polynomial regressions. This investigation was conducted
for 3 consecutive seasons.
Results showed that mainly K, Ca and Mg
were involved in the development of post harvest fruit disorders. The Ca + Mg/K
ratio in the subsoil (25 to 50 cm depth) should be higher than 6.4 to reduce
gray pulp, whereas a high K-status (low Ca + Mg/K ratio) in the soil and plant
will minimize the development of both vascular
browning and pulp spot. It is, therefore, impossible to completely eliminate
all three disorders since K should be low in the one instance and high in the
other.
Physiological postharvest
fruit disorders are causing serious problems in the marketing of South African
fruit on local as well as overseas markets. On a visit to the Rungis market in Paris, Bezuidenhout (1983) reported
that 6.7% of the South African fruit sampled on the market, showed pulp spot
symptoms, 19.9% gray pulp and 29.0% vascular browning.
Several investigations have been undertaken
to identify the cause of these disorders. Ginsberg (1985) speculated on the
role of calcium and concluded that increased uptake of calcium might alleviate
the problem. The possible role of calcium and water stress on these disorders
was investigated extensively by Bower (1984, 1985, 1988), Bower and Cutting
(1987,1988) and Bower and Van Lelyveld (1986), which
led them to speculate that a pre-harvest water stress especially during the
first three months after fruit set, will increase the postharvest
browning potential of the fruit. Vorster and Bezuidenhout (1988) showed that fruit without pulp spot symptoms had a higher Ca and Zn concentration
than fruit with pulp spot, but concluded that these results were only
preliminary.
In another investigation, Hofman and Husband
(1987) concluded that polyphenol oxidase,
abscisic acid and gibberellins showed no consistent
relationship to the development of pulp spot and gray pulp.
The first positive indication of factors
involved in the development of gray pulp, pulp spot and vascular browning was
given by Koen et al. (1990). They showed that Ca,
Mg and K were involved in the development of these disorders and concluded that
insufficient soil K rather than excessive Ca and Mg were responsible for the
development of pulp spot and vascular browning. Gray pulp on the other hand was
enhanced by excessive K levels in the leaves and fruit or insufficient Ca and
Mg levels.
The purpose of this investigation was,
therefore, to verify the preliminary results of Koen et
al. (1990) by using data available
from fertilizer experiments.
Materials and Methods
Three existing fertilizer trials
(investigating N, P and K, respectively) with 'Fuerte'
trees on Duke 7 rootstocks at the Friedenheim
Experimental Farm near Nelspruit were used for this
investigation. Each trial consisted of 8 levels of either N or P or K with 3
trees per plot and 3 replicates. The trees were 10-yrs-old at the start of this
investigation.
Leaf and soil samples were taken during
March (Keen and du Plessis,
1991), and the soil was sampled at two depths (0-25 and 25-50 cm). The fruit
were harvested during April. One carton of fruit was taken from each plot for
cold storage and one for analytical purposes. The fruit for cold storage was
stored for 31 days at 5.5C and thereafter for a further 3 days at 21C. As soon
as the fruit were soft they were cut open and rated for the occurrence of pulp
spot, gray pulp and vascular browning. The extent of each disorder was
expressed as the percentage of affected fruit per sample. From the fruit
sampled for analysis purposes, separate samples were taken from the proximal,
middle and distal parts, dried at 60C, ground and analyzed. In all cases the
relationship between the chemical composition of the leaves, fruit and soil and
the physiological disorders were computed by means of polynomial regressions.
Results and Discussion
This investigation covers the three most
important postharvest fruit disorders in avocado
namely gray pulp, pulp spot and vascular browning, as defined by Swarts (1984). Gray pulp was the most common disorder
during the three seasons of this investigation, with 5 to 60 % of the fruit
developing this disorder after cold storage. Vascular browning occurred in two
of the three seasons whereas pulp spot was only found in the 1989 season (35 % of all the fruit was affected).
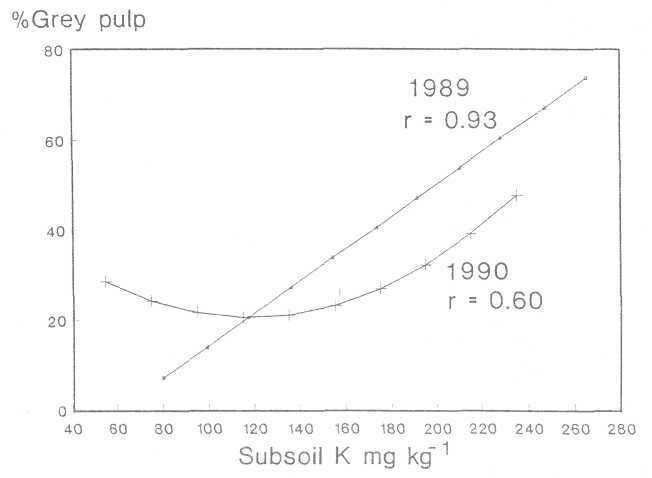
Gray pulp. Table 1 shows the relationships obtained between
soil composition and occurrence of gray pulp after cold storage over a period
of three seasons. Only significant relationships are shown. The subsoil
composition of especially K, Ca and Mg shows very consistent results over this
3 year period. Increased K concentration increased the incidence of gray pulp
very strongly (Fig. 1) as indicated by the high regression coefficients (r =
0.92, 0.93 and 0.60 for the three seasons, respectively). Both
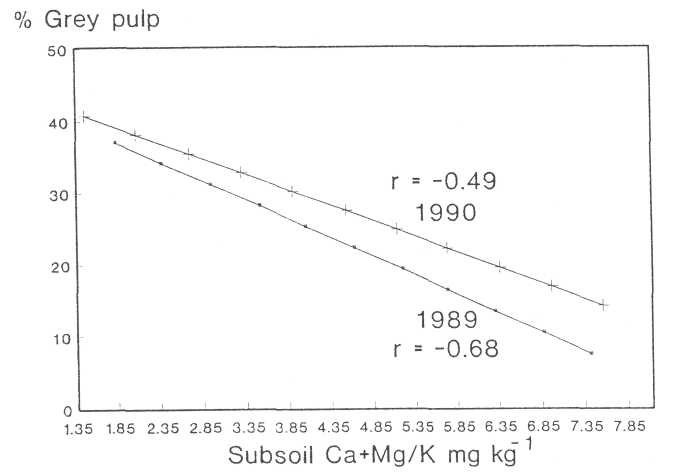
Ca and Mg showed negative relationships with the occurrence of gray pulp, which
means that an increase in soil Ca or Mg decreased the development of gray pulp
in the fruit. The ratio between Ca, Mg and K in the soil is also of
significance. Gray pulp decreased with an increase in the ratio of Ca + Mg/K
(Fig. 2). This ratio varied between 1.5 and 8.2 over the three seasons and
should be higher than 6.4 to reduce the incidence of gray pulp to less than
20%. The optimal Ca + Mg/K ratio in soils for subtropical crops is 4 to 5 (Koen et al. 1990).
Table 2 shows the significant relationships
obtained between fruit analysis and gray pulp for the 1989 and 1990 seasons.
For 1989 only the P, Ca and Mg concentration in the middle part of the fruit were
related to the development of gray pulp after cold storage. In all three cases
the response was negative such that an increase in P, Ca or Mg concentration in
the fruit reduced the development of gray pulp. The same effect was obtained in
the 1990 season with the only difference being that Ca and Mg had a linear (1st
order) negative effect on gray pulp. The same 1st order negative effect was
also obtained with Mg in the proximal part of the fruit. For the 1989 season,
an increase in K concentration of the fruit increased the percentage of fruit
with gray pulp, but this effect was not observed in the following season. These
data are in accordance with the soil analysis data shown in Table 1. From the
data shown in Tables 1 and 2, it can be concluded that a subsoil analysis could
be a more reliable indicator of the possible development of gray pulp in a
particular orchard than either fruit, leaf or topsoil analysis.
Vascular browning. Since the incidence of fruit with vascular browning
was very low for the 1988 season, only data for 1989 and 1990 are presented
(Table 3). Leaf analyses show a negative relationship of K with vascular
browning in both seasons but subsoil K and leaf N only for 1989. From these
results it is suggested that a K level in the subsoil above 98 mg K/kg and in
the leaves above 1.4 % K, is likely to reduce the incidence of vascular
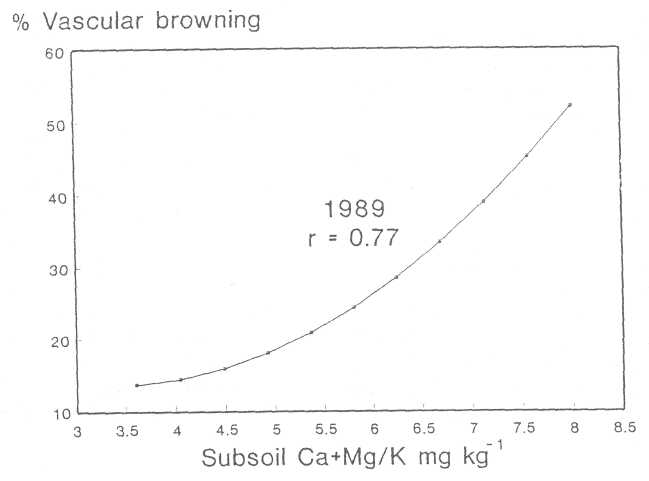
browning. These results were supported by the fact that a decrease in the Ca/K
and Ca + Mg/K ratios in the soil also reduced vascular browning (Fig. 3). This was in agreement with the
findings of Koen et al. (1990) who stated that
the Ca + Mg/K ratio in the subsoil should be lower than 5 to minimize the
incidence of vascular browning. Fruit analyses (Table 4) show a highly
significant relationship between increased fruit N and the development of
vascular browning for the 1989 season only. Mg was the only element showing a
consistently positive relationship with vascular browning in both seasons. This
was in agreement with the negative trend observed for the K/Mg in the leaves
and development of vascular browning. Therefore, an increase in K should reduce
the Mg status of the plant (leaf K versus leaf Mg; r =-0.62 and -0.78 for 1989
and 1990 respectively) and the fruit (leaf K versus fruit Mg; r = -0.62).
Pulp spot. The incidence of fruit with this disorder was
relatively low in the fertilizer experiments used for this investigation. Only
for the 1989 season was pulp spot
present and some relationships obtained with certain elements in the fruit
(Table 2). Potassium in the proximal part of the fruit showed a highly
significant relationship with pulp spot. The lowest occurrence of pulp spot was
associated with a K concentration of between 1.45 and 1.65 % K. Both higher and
lower K values increased the incidence of pulp spot, but especially lower
values. In the distal part of the fruit, K showed a linear negative effect on
pulp spot. No relationship was observed for the middle part as far as K was
concerned. The Ca concentration in the middle part, however, showed a first
order positive relationship with pulp spot, implying that higher Ca
concentrations in the fruit will favor pulp spot development. In an extensive
survey of avocado orchards Koen et al. (1990)
also found a significant relationship between fruit K concentration and pulp
spot. They concluded that the K concentration in the proximal half of the fruit
should be higher than 1.5 % K, which is in good agreement with the 1.45 to 1.65
% K found in this investigation.
Conclusions
Fruit from three independent N, P, and K
fertilizer trials were used for this investigation. The occurrence of gray pulp
symptoms in these fruit varied between 5 and 60% for the three seasons under
investigation. Vascular browning was absent during the 1988 season but in 1989
and 1990 up to 45% and 60%,
respectively, of the fruit developed symptoms after cold storage. Pulp spot was
only present in the 1989 season, when 35% of the fruit developed this disorder.
It was shown that a subsoil analysis (especially the Ca + Mg/K ratio) should be
more reliable in predicting the possible occurrence of gray pulp than either
fruit, leaf or topsoil analysis. In this case
the ratio of Ca + Mg/K should be higher than 6.4 to reduce the occurrence of
this disorder to a minimum.
In the case of vascular browning, a higher
leaf and soil K, lower Ca + Mg/K ratio and lower Mg in the fruit reduced the
percentage of fruit developing this disorder after cold storage. It was shown
that a higher leaf K level reduced the leaf Mg and thus the fruit Mg, which in
turn reduced the incidence of vascular browning. Therefore by increasing the K
status of the soil, the Ca + Mg/K ratio decreased, K uptake increased, whereby
Mg levels in the fruit were reduced and the development of vascular browning
minimized.
Pulp spot was a factor in the 1989 season
only. Fruit analysis show a relationship between K and
Ca and the development of this disorder. Fruit K concentration should be
relatively high (1.45 to 1.65 %) and Ca relatively low to reduce the incidence
of pulp spot.
From this investigation it can be concluded
that K, Ca and Mg were involved in the development of postharvest
fruit disorders. The ratio between these elements in the soil (Ca + Mg/K ratio)
should be higher than 6.4 to reduce gray pulp, whereas a low ratio (or high
K-status in the soil and plant) will minimize the development of both vascular
browning and pulp spot. Therefore, by keeping the Ca + Mg/K ratio in the soil
in the optimal range of 4 to 5, gray pulp will always be present to a certain
extent, but pulp spot and vascular browning will be minimized.
Literature
Cited
Bezuidenhout, J.J. 1983. Die voorkoms van mesokarpverkleurings
by Fuerte avokado's op die Rungis mark gedurende 1982. S. A. Avocado Growers' Assn. Yrbk.
6:4-27.
Bower, J.P, 1984, Effect of fruit water stress and
irrigation regime in the ripening of stored avocado fruit, cultivar Fuerte. S. A. Avocado Growers' Assn. Yrbk. 7:55-56.
Bower, J.P. 1985. The calcium accumulation pattern
in avocado fruit as influenced by long-term irrigation regime. S. A. Avocado Growers' Assn. Yrbk.
8:97-99.
Bower, J.P. 1988. Pre- and postharvest
measures for long-term storage of avocados. S. A.
Avocado Growers' Assn. Yrbk. 11:68-72.
Bower, J.P. and Cutting, J.G.M. 1987. Some factors affecting postharvest
quality in avocado fruit. S. A. Avocado Growers' Assn. Yrbk. 10:143-146.
Bower, J.P. and Cutting, J.G.M. 1988. Avocado fruit development and
ripening physiology. Hort. Rev. 10:229-271.
Bower, J.P. and Van Lelyveld,
L.J. 1986. The
effect of long-term irrigation regime on avocado fruit polyphenol
oxidase browning potential. S.
A. Avocado Growers' Assn. Yrbk. 9:51-53.
Ginsberg,
L. 1985. Postharvest physiological problems of avocados. S. A. Avocado Growers' Assn. Yrbk. 8:8-11.
Hofman,
P.J. and Husband, B.M. 1987. The involvement of polyphenol oxidase, abscisic acid and gibberellins in the expression of mesocarp discolouration in
'Fuerte1 avocado fruit. S. A. Avocado Growers'
Assn. Yrbk. 10:135-137.
Koen,
T.J. and Du Plessis, S.F.
1991. Bepaling
van die korrekte blaarmonster en tyd van monsterneming van Fuerte avokado's vir
bemestingsadviesdoeleindes. S. A. Avocado Growers' Assn. Yrbk. 14:19-21.
Koen,
T.J., Du Plessis, S.F. and Terblanche, J.H. 1990. Nutritional factors involved in
physiological postharvest fruit disorders of avocados
(cv. Fuerte). Acta Horticulturae 275:543-550.
Swarts,
D.H. 1984. Postharvest problems of avocados-lets talk the same language. S. A. Avocado Growers' Assn. Yrbk.
7:15-19.
Vorster,
L.L and Bezuidenhout, J.J. 1988. Does zinc play a
role in reducing pulp spot? S. A. Avocado Growers' Assn. Yrbk. 11:60.