Proc. of
Second World Avocado Congress 1992 pp. 343-348
Boron Fertilization of 'Sharwil' Avocados in Kona, Hawaii
Susan C.
Miyasaka, Ty G. McDonald, and Dennis T. Matsuyama
Hawaii
Branch Station, 461 W. Lanikaula St., Hilo, HI 96720, USA
Elizabeth
A. Graser and I. Scott Campbell
Department
of Agronomy and Soil Science, University of Hawaii, Honolulu, HI 96822, USA
Abstract. Misshapen fruits of Persea americana Mill. cv. Sharwil were observed during the 1989-90 harvest season in Kona, Hawaii. To determine whether these fruit deformities were caused by boron (B) deficiency, B (0 and 23 g/tree), as solubor, and nitrogen (N) (90, 180, and 270 g/tree), as urea, were applied in a factorial combination to single tree plots on 8 cooperating farms. The first B application (February, 1990) significantly increased foliar B concentrations of the spring vegetative flush sampled in June, 1990; however, these B concentrations were still below the recommended level of 50 mg/kg. The second B application (June, 1990) significantly increased foliar B concentrations of the summer vegetative flush sampled in October, 1990, and these B concentrations were within the recommended B range. During the 1990-91 harvest season, B applications significantly increased the weights of deformed fruit. Perhaps, this increase in weights of deformed fruit on trees given B fertilizer was due to insufficient B levels in the tree after the first B application, during the critical period of flowering and early fruit development. Observations are being continued during the 1991-92 growing season.
In Hawaii, the principal avocado (Persea americana Mill.) cultivar is 'Sharwil' (Bittenbender et al., 1989), a cross between Mexican and Guatemalan races. Avocado production in this state is centered in the district of Kona on the Island of Hawaii, typically on organic soils that are classified as Tropofolists (Histosols). These soils are unique, because they are composed of a thin organic surface layer underlain by lava (USDA- SCS, 1973).
Misshapen fruits of 'Sharwil' with a lop-sided, bumpy appearance were observed during the 1989-90 season (Bittenbender, 1990). Most of these fruit deformities did not appear to be similar to those reported by Fisher and Davenport (1989) that were possibly due to flower thrips damage. Rather, they appeared to be similar to those reported by Piccone and Whiley (1987) and Broadley et al. (1991), which were caused by B deficiency.
It was hypothesized that B deficiency was the major cause of these misshapen fruits, because the foliar B concentration found at over 10 farms in the Kona area was typically 20 mg/kg; whereas, the recommended level is 50 mg/kg (Piccone and Whiley, 1987). Moreover, 'Sharwil' avocados were reported to be especially susceptible to B deficiency (Piccone and Whiley, 1987).
This N by B factorial experiment was planned, because Florida's recommendation for annual B application is 1% of the rate for N (FAIRS, 1990). The objectives of this on-farm fertilizer trial in Kona, Hawaii were to investigate the role of B as the cause of misshapen 'Sharwil' fruit and to determine the optimum levels of N and B fertilizer to obtain both high yields as well as good fruit quality.
Materials and Methods
From 1989 to 1990, a farm survey of avocado grower practices was conducted in Kona, Hawaii, to identify potential farmer-cooperators for this fertilizer study and to determine current fertilization practices (Mills-Packo et al., 1990). Eight farmers agreed to participate in this fertilizer trial, and the elevation of their farms and characteristics of their 'Sharwil' avocado trees are shown in Table 1.
In April and June, 1990, three rates of N (90, 180, and 270 g/tree per application), as urea, were broadcast under the tree canopy. The middle N fertilizer treatment is the most commonly applied N rate for avocados in Kona, Hawaii (Mills-Packo et al., 1990). This N rate was halved for the low N treatment to determine if avocado trees are being over-fertilized. The high N rate is 50% greater than the middle N treatment to determine whether avocado yields could be improved by higher N fertilization. In October, 1990, N (45, 90, and 135 g/tree), as urea, was broadcast, based on the recommendation by Piccone and Whiley (1987) to reduce N fertilization during the fall months.
Two rates of B (0 and 23 g/tree/application), as solubor, were applied as a spray to the ground under the tree canopy in February, 1990, and these treatments were repeated in August and December of 1990. These B rates were selected from recommendations of Piccone and Whiley (1987), which were based on leaf B analyses and canopy diameters.
The experimental design was a randomized complete block, with each farm equivalent to a replicate. The three N and two B rates were applied in a factorial combination. In April and June, 1990, potassium (K), as sulfate of potash, was broadcast under all experimental trees at 240 g/tree/application. In October 1990, K at 120 g/tree was broadcast, based on the recommendation by Piccone and Whiley (1987) to reduce K fertilization during the fall. Phosphorus (P), as treble super phosphate, was broadcast under all experimental trees at 30 g/tree/application in April, June, and October of 1990.
New vegetative flushes were tagged in April, 1990. Leaf samples from non-flowering, non-bearing, and non-flushing terminals of this spring vegetative flush were taken in June, 1990, when leaves were 2-months-old (prior to fertilization).
Leaf samples from non-flowering, non-bearing, and non-flushing terminals of the summer vegetative flush were taken in October, 1990, when leaves were 3- to 4-months-old (prior to fertilization). The leaf samples were analyzed for total nitrogen by the micro-Kjehldal method (Isaac and Johnson, 1976; Nelson and Sommers, 1972) and for B by the azomethine-H method (Wolf, 1974). Levels of other elements (P, K, Ca, Mg, Na, Mn, Fe, Cu, Zn, and Al) were determined using inductively-coupled plasma emission spectroscopy (Isaac and Jones, 1972).
Individual tree yields were determined from October, 1990 through March, 1991, as fruit matured. Fruits were separated into the following categories: grade 1 (unblemished), off-grades due to deformities, offgrades due to Mexican leafroller (Amorbia emigratelia Busck) damage, and off-grades due to other factors.
The data were analyzed statistically by analysis of variance (ANOVA) using SAS computer programs (SAS Institute, Inc., Gary, NC). A probability level of 0.05 or less was considered to be statistically significant. Data are presented as mean ± standard error of the mean.
Results and Discussion
Foliar Analyses of Spring Vegetative Flush. Application of B significantly increased concentrations of foliar B in the spring vegetative flush (P<0.006); however, the highest foliar B concentration was only 34 mg B/kg (Fig. 1). According to Piccone and Whiley (1987), a foliar level of less than 50 mg B/kg is considered to be low, and 'Sharwil1 trees are particularly sensitive to B deficiency. Thus, the first application of B in February, 1990, was insufficient to increase foliar B concentrations to the recommended range during the critical period of flowering, fruit set, and early fruit development, which occurred from January to March, 1990.
Increased N rates also significantly increased B concentrations in the leaves (P<0.02; Fig. 1). Perhaps, this effect was due to increased general vigor of the avocado trees as N levels increased.
There was no significant effect of N or B fertilizer rates on total N concentrations in the leaves, although a significant quadratic N by B interaction was found for foliar N concentrations (P<0.03). However, this significant statistical effect may have little biological significance, because differences in foliar N concentration were slight, with treatment means ranging from 18.0 ± 0.6 to 20.0 ± 0.6 g/kg. These total N concentrations were within the most productive range reported for 'Fuerte' avocado leaves (Embleton and Jones, 1966).
Foliar Analyses of Summer Vegetative Flush. Boron applications significantly increased foliar B levels in the summer vegetative flush (P<0.002; Fig. 2). The concentrations of foliar B in trees fertilized with solubor were within the recommended range for B (Piccone and Whiley, 1987; Embleton and Jones, 1966). In contrast, the foliar B concentrations in trees not supplied with B were less than the recommended B range (Fig. 2).
A significant quadratic N effect was found for total N concentrations in the leaves (P<0.038); however, this effect depended on the rate of B applied. Again, the differences between treatment means of total N concentrations were slight, with means ranging from 19.1 ± 1.1 to 21.8 ± 0.9 g/kg. Some of the total N concentrations in leaves at the two higher N rates tended to be greater than 20.0 g/kg, which could result in reduced fruit yields (Embleton and Jones, 1966).
Fruit Yields. There were no significant N treatment effects or N by B interactions on avocado fruit yields in any category. Also, no significant treatment effects were found on individual fruit weights, which were an average of 0.40 ± 0.9 kg/fruit.
An increased B level significantly increased fresh weights of deformed fruit (P<0.05; Fig. 3) as well as increased the numbers of deformed fruit (P<0.07; data not shown). Boron applications somewhat increased total fresh weights of fruit from 25 ± 5 to 30 ± 5 kg/tree; however this effect was not statistically significant (P<0.29). Percentage of deformed fruit increased slightly from 19 ± 5 to 24 ± 5 % with B application; however, this effect was not statistically significant (P<0.40).
The significant increases in fresh weights of deformed fruit with B fertilization contradicts the hypothesis that inadequate B is the cause of misshapen avocado fruits.
One possible explanation for the B effect of increasing the yields of deformed fruit is that the first B application in February, 1990, resulted in foliar B levels that were still in the deficiency range (Fig. 1). Flowering, fruit set, and early fruit development of 'Sharwil' avocados in Kona occurred from January to March, 1990. Field observations showed that fruit deformities were apparent within one to two months after fruit set. Perhaps, the B levels in B-fertilized trees were insufficient to prevent early fruit deformation. However, later B applications resulted in B levels that were sufficient to increase the numbers and weights of deformed fruit that were carried to maturity.
The levels of foliar B following two B applications are now within the recommended range (Fig. 2). Data from the 1991-92 harvest should increase our understanding of whether B is the cause of deformed 'Sharwil' avocado fruits in Kona, Hawaii.
The authors would like
to thank C.E. McCulloch of the Biometrics unit at Cornell University for his
assistance in experimental design and statistical evaluation of the data. Also,
they would like to acknowledge that the nutrient analyses of avocado leaves
were carried out by the Agricultural Diagnostic Services Center at the
University of Hawaii. This research was supported by a grant from the
Governor's Agricultural Coordinating Committee Project 89-44. Mention of a
trade name does not constitute a recommendation for use by the University of
Hawaii.
Literature Cited
Bittenbender, H.C. 1990. The Daruma Sharwil: 1990 Year of the Misshapen Sharwil. Aloha Avocado 1: 4-5.
Bittenbender, H.C., N. Kefford, and K.G. Rohrbach. 1989. Avocado Industry Analysis: Number 3. Coll. Trop. Agr. and Human Res., Univ. Hawaii, Honolulu, HI.
Broadley, R.H., S.N. Ledger, and A.G. Banks. 1991. Disorders, p. 27, 62. In: R.H. Broadley (ed.) Avocado Pests and Disorders. Queensland Dept. of Primary Industries, Brisbane, Australia.
Embleton, T.W. and W.W. Jones. 1966. Avocado and mango nutrition, p. 51-76. In: N.F. Childers (ed.) Nutrition of Fruit Crops: Tropical, sub-tropical, temperate tree and small fruits. Hort. Publ., Rutgers State Univ., New Brunswick, NJ.
Fisher, J.B. and T.L. Davenport. 1989. Structure and development of surface deformations on avocado fruits. HortScience. 24: 841-844.
Florida Agricultural Information Retrieval System (FAIRS). [Database]. 1990. IFAS, Univ. Florida, Gainesville, FL.
Isaac, R.A. and J. Benton Jones, Jr. 1972. Effects of various dry ashing temperatures on the determination of 13 nutrient elements in five plant tissues. Comm. Soil Sci. Plant Anal. 3: 261-269.
Isaac, R.A. and W. C. Johnson. 1976. Determination of total nitrogen in plant tissue, using a block digestor. J. Am. Org. Anal. Chem. 59:98-100.
Mills-Packo, P., E. Mehos, and S.C. Miyasaka. 1990. Results of the 1990 survey of avocado growers in Hawaii. Aloha Avocado. 1:1.
Nelson, D.W. and L.E. Sommers. 1972. Determination of total nitrogen in plant material. Agron. J. 65: 109-112.
Piccone, M.F. and A.W. Whiley. 1987. Avocado Fact Sheet: Nutrition. Queensland Department of Primary Industries, Brisbane, Australia. 9 p.
United States Dept. Agric. - Soil Conservation Service (USDA-SCS). 1973. Soil Survey of Island of Hawaii, State of Hawaii. U.S. Government Printing Office, Washington, D.C. 115 p.
Wolf, B. 1974. Improvements in the azomethine-H method for the determination of boron. Commun. Soil Sci. and Plant Anal. 5:39-44.
|
Table 1. Elevation of 8 cooperating farms and characteristics of 'Sharwil' trees at the initiation of this study. |
||||
|
Farm |
Elevation (m) |
Age from grafting (yr) |
Trunk diameter (cm)2 |
Canopy diameter, (m) |
|
AR |
460 |
3.5 |
12.5 (0.2) |
4.2 (0.1) |
|
BE |
610 |
8.0 |
16.9 (0.4) |
4.5 (0.1) |
|
KA |
430 |
3.5 |
14.7 (0.4) |
4.6 (0.1) |
|
LA |
550 |
4.0 |
19.1 (1.3) |
4.0 (0.1) |
|
MA |
400 |
3.5 |
12.0 (0.4) |
4.2 (0.1) |
|
MC |
260 |
9.0 |
25.1 (0.8) |
7.3 (0.2) |
|
ME |
370 |
6.0 |
17.3 (0.6) V |
6.2 (0.2) |
|
NO |
430 |
5.0 |
11.4 (0.3) |
3.5 (0.1) |
|
z Means are followed by standard errors of the mean, in parentheses. v Only the largest stem was
measured, when multiple stems occurred at the ME farm. |
||||
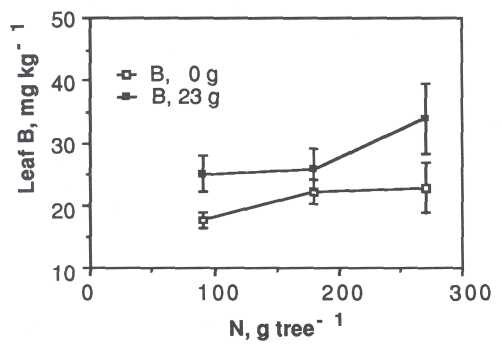
Fig. 1. The effects of N and B treatments on foliar B concentrations of the spring vegetative flush.
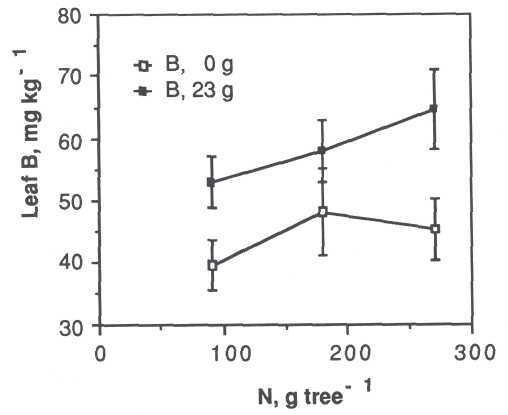
Fig. 2. The effects of N and B treatments on foliar B concentrations of the summer vegetative flush.
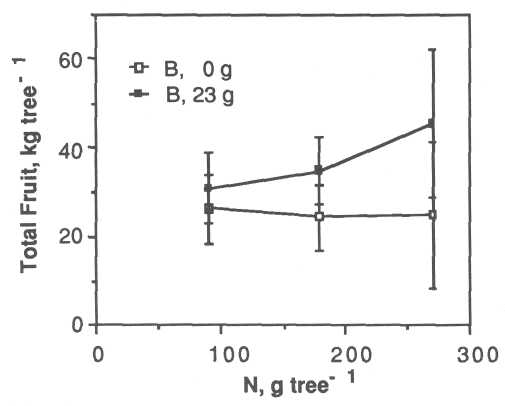
Fig. 3. The effects of N and B treatments on total fruit yields.