Proc. of Second World Avocado Congress 1992 pp. 331-335
Irrigation and Fertilizer Management to Minimize Nitrate Leaching in Avocado Production
Marylynn
V. Yates, David E. Stottlemyer, and Jewell L. Meyer
Department
of Soil & Environmental Sciences, University of California, Riverside, CA
92521, USA
Mary L.
Arpaia
Department
of Botany & Plant Sciences, University of California, Riverside, CA 92521,
USA
Abstract. Contamination of ground water by nitrates is one of the major sources of non-point pollution in the United States. A recent survey by the United States Geological Survey (USGS) suggested that use of fertilizers by agriculture is a large contributing factor to elevated nitrate levels. In their survey of more than 2700 wells in California, the USGS found that more than 10% had nitrate levels that exceeded drinking water standards. The purpose of this study is to try to minimize nitrate contamination of ground water by effectively managing fertilizer and irrigation applications to Persea americana cv. Hass. The study is being conducted at a site in western Riverside county, as part of a larger study on irrigation and fertilizer management of avocados. The treatments consist of three irrigation levels (80%, 100%. and 120% of ETC) and two fertilization levels (0 and 1.4 kg N/tree/year). Fertilizer is applied by broadcasting it evenly within the canopy drip line. Applications have been split into 1/2, 1/4, and 1/8 of the yearly fertilizer allotment. Nitrate leaching is monitored using suction cup lysimeters installed at 1.5 m depth. Soil-water samples are collected weekly to biweekly and analyzed for the presence of nitrate-N. Results of this study have shown that the amount of nitrate leaching is positively correlated with the amount of fertilizer applied in a single application. To date, no clear relationship between the irrigation level and nitrate concentration in the soil water has been established.
Nitrate contamination of ground water has been a problem in the United States for many years and continues to occur. A survey of wells conducted by the U.S. Geological Survey in 1985 found that more than 10% of the 2732 wells sampled in California contained nitrates at concentrations exceeding the Federal drinking water standard of 10 mg/L nitrate-nitrogen (nitrate-N) (USGS, 1985). The State Water Resources Control Board listed increasing nitrate contamination of ground water as one of six major water quality problems in California (Patrick et al., 1987).
There are several sources of nitrogen (N) in soil, including on-site domestic waste disposal systems (e.g., septic tanks and cesspools), dairies, animal feedlots, and irrigation with sewage effluent. Application of fertilizer as an agricultural practice is a major contributor to the total load of nitrogen in the soil. One study found that since the 1960's, an increase in the use of nitrogen fertilizers has been accompanied by a concomitant increase in the levels of nitrates in ground water (Power and Schepers, 1989).
Under ideal conditions, only the amount of fertilizer that can be used by the plant would be applied, leaving no residual to move below the root zone. However, in most cases, not all of the applied nitrogen is assimilated by the plant, allowing some to move below the root zone. Nitrogen in the soil that is not returned to the atmosphere in the form of nitrogen gas or ammonia is generally converted to the nitrate form by bacteria. Nitrate is very mobile, and if there is sufficient water in the soil, it can move readily through the soil profile. Careful management of nitrogen and water applications should be able to minimize the amount of nitrogen moving below the root zone, thus minimizing the potential for nitrate contamination of ground water.
The
purpose of this project was to study the influence of nitrogen and irrigation
management on the movement of nitrate in the soil below the root zone of mature
avocado (Persea americana cv. Hass) trees.
Materials and Methods
The trials were conducted in an orchard of mature 'Hass' avocado trees located near Corona, California. Three different irrigation levels were maintained in the orchard: 80, 100, and 1 20% of the crop evapotranspira-tion (ETC) level. Water was applied using low-volume sprinklers that deliver 23.5 L/h. Each experimental row (i.e., a row that contained trees that received a treatment) of approximately 20 trees was bordered on both sides by a non-experimental guard row.
Soil-water
access tubes made of PVC with ceramic cups at the end were placed in the soil
at a depth of 1.5 m. Twenty-seven access tubes were installed at random trees
distributed among the three irrigation treatments as follows: 80% ETC,
9 tubes; 100% ETC, 7 tubes; and 120% ETC, 11 tubes.
Samples of the soil water were obtained by placing a suction on the tube and
extracting the sample. When the soil was very dry, it was necessary to allow
the suction to remain for up to 48 hours before it was possible to extract an
adequate amount of water for chemical analysis.
The concentration of nitrate-N in the soil water was monitored for 4 fertilization cycles. The first samples were collected five days prior to the first nitrogen application to obtain information on the baseline levels of nitrate-N in the soil water. Fertilizer application dates and amounts were as follows: February 28, 1989, 0.68 kg N; June 14, 1989, 0.34 kg N; October 17, 1989, 0.34 kg N; and June 29, 1990, 0.17 kg N. Soil-water samples were collected every one to two weeks at as many sites as it was possible to obtain water. In each case, the level of nitrate-N in the soil water was allowed to return to background levels prior to application of fertilizer. The fertilizer was applied by manual broadcasting evenly within the wetted zone of the tree.
Results
The measured concentrations of nitrate-N in the soil water at 1.5 m below the soil surface varied considerably from site to site on a given day (Figure 1). Variations of this magnitude are not unexpected in a field setting, and may be a function of differences in the soil properties at the various sampling locations. Therefore, the influence of the spatial orientation of the sampling sites relative to one another was investigated. Spatial analyses of the data have been performed, and they indicate that the distance between sampling locations does correlate with the observed pattern of nitrate-N movement.
Average nitrate-N concentrations in the soil water for all three irrigation treatments over the four fertilization cycles are shown in Figure 2. It is obvious on inspection that there is a relationship between the amount of applied fertilizer and the maximum nitrate-N concentration in the soil water; however, the relationship between the irrigation treatment and nitrate-N concentration is not as clear. Two-way analysis of variance (Sokal and Rohlf, 1981) was performed to determine the source(s) of variation in the observed results. Maximum nitrate-N concentrations at each sampling site for each fertilizer application were used for this analysis. Results of the ANOVA showed that both fertilizer application cycle and irrigation treatment were significant (P<0.001 and P<0.01, respectively) sources of variation in maximum nitrate-N levels.
The data were also analyzed to determine whether a linear relationship between the maximum nitrate-N concentration and irrigation treatment and/or fertilizer application existed. For this analysis, it was necessary to determine the exact amounts of water and nitrogen applied to the trees during each fertilization cycle. Because the irrigation water contained a relatively high concentration of nitrogen (average 13 mg/L), the contribution of the irrigation water to the total nitrogen loading was included in the analysis.
The results of the multiple regression analysis showed that there is a strong linear relationship between the maximum nitrate-N concentration and the amount of applied nitrogen, with the correlation being significant at the P<0.0025 level. Approximately 60% of the variation in maximum nitrate-N concentrations could be explained by the amount of applied nitrogen. The relationship between the amount of applied water and the maximum nitrate-N concentration was much weaker: the correlation was significant at the P<0.18 level. Adding applied water as a source of variation in the maximum nitrate-N concentration resulted in an increase of r2 from 0.6062 to 0.6778. The relationship between applied nitrogen amount and maximum nitrate-N concentration in the soil water is depicted graphically in Figure 3.
The data were also analyzed to determine whether any differences in the dispersion of the nitrate-N occurred as a result of the different treatments. Dispersion can be defined as the spreading out of the nitrate-laden water as it moves through the soil profile around the soil particles, resulting in dilution of the nitrate. Two-way analysis of variance was used to calculate whether the different irrigation treatments or the fertilizer application cycles (i.e., the amount of applied nitrogen) were significant sources of variation in the dispersion at different sampling sites. Results of the ANOVA showed that neither irrigation level nor amount of applied fertilizer was significantly correlated with the nitrogen dispersion (P<0.20).
Discussion
This project has shown that the amount of nitrate leaching below the root zone of mature avocado trees is strongly correlated with the Hass of applied nitrogen. Smaller, more frequent applications of fertilizer appear to minimize the potential for nitrate leaching, and thus groundwater contamination.
The relationship between the applied water and nitrate leaching is not as apparent. In this study, no correlation was found between the amount of applied irrigation water and the leaching of nitrate below the root zone. It may be that the differences in the amounts of applied water in the three irrigation treatments were too small to cause significant differences in the concentration of nitrate-N leached.
One very important observation in this study is the extreme variation in measured nitrate-N concentrations at the 27 sites in this orchard. The high variability of observations in a field setting illustrates the need for large numbers of replicates in any study of this nature. In this study, the variability between sites was found to be a function of the position of the sampling location in the plot. Sites close to one another had similar patterns of nitrate leaching. As the separation distance between sites increased, the differences between the calculated dispersion of the nitrate-N also increased.
Literature Cited
Patrick, R.E. Ford, and J. Quarles. 1987. Groundwater contamination in the United States. 2nd ed. University of Pennsylvania Press, Philadelphia.
Power, J.F. and J.S. Schepers. 1989. Nitrate contamination of groundwater in North America. Agri. Ecosys. Environ. 26:165-187.
Sokal, R.R. and F.J. Rohlf. 1981. Biometry. 2nd ed.
W.H. Freeman and Company, San Francisco.
United States Geological Survey. 1985. National water summary 1984, hydrologic events, selected water-quality trends, and ground-water resources. Water Supply Paper 2275.
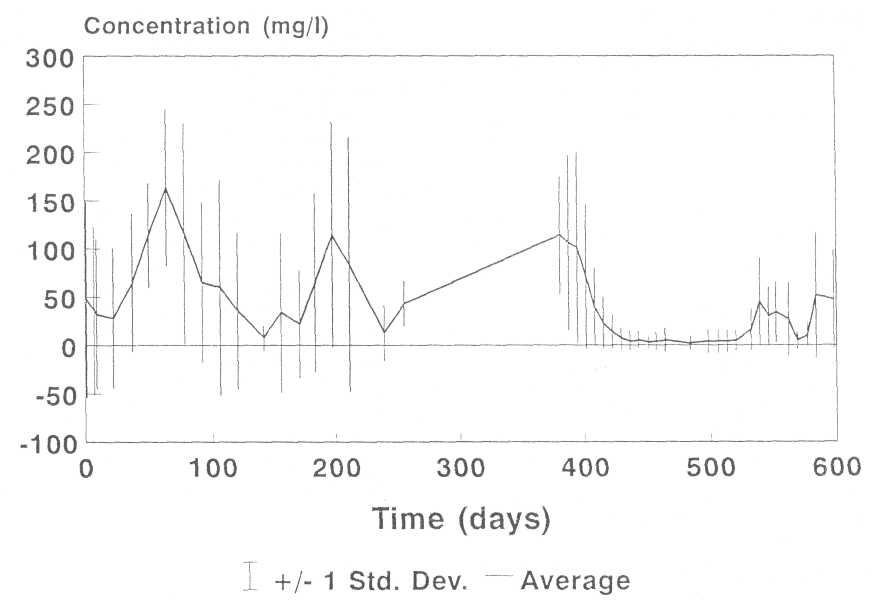
Figure 1. Nitrate-N in soil water 80% ETc
treatment.
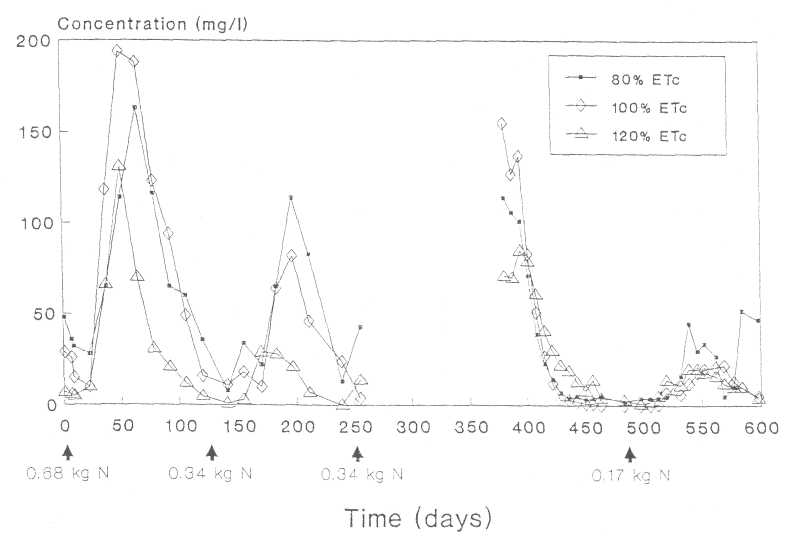
Figure 2. Average nitrate-N in soil water for three
irrigation treatments.
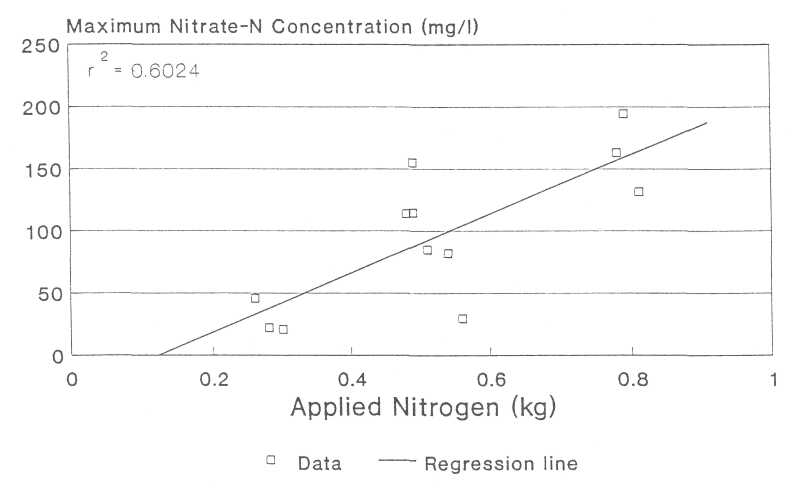
Figure 3. Effect of applied nitrogen on maximum nitrate-N.