Proc. of
Second World Avocado Congress 1992 pp. 289-299
Optimal Leaf Analysis Norms for Avocado (cv.Fuerte)
T.J.
Koen and S.F. du Plessis
Citrus and
Subtropical Fruit Research Institute, Private Bag X11208,Nelspruit, 1200,
Republic of South Africa.
Abstract. The objective of this investigation was to determine
a suitable leaf sample for analysis and fertilizer advisory purposes and to
obtain optimal analysis norms for that sample. The leaf sample proposed by Koen
and du Plessis (1991. S. A. Avocado Growers' Yrbk. 14:19-21), Fig. 1, conformed
to all the requirements necessary for sampling purposes. Firstly, the
concentration of elements in the leaves was constant from 6 to 8 months of the
leaf's age. Secondly, the nutrient concentration of the sample was highly
significantly affected by changes in the fertilizer applications and thirdly,
nutrient concentration was also related to changes in yield. The sample was
especially suitable for N, with an optimal level of 2.0 to 2.3% N. This
analysis could be used for the same or subsequent season. In the case of P the
leaf P concentration must be higher than 0.17% to ensure optimal yield in the
next season. The relationship between leaf K and yield was relatively poor.
Leaf
analysis as a diagnostic tool for fertilizer advisory purposes is widely used
on many subtropical crops throughout the world (Du Plessis, 1977; Gustafson,
1981; Lahav et al., 1990). Embleton and Jones (1966) proposed tentative
leaf analysis norms for avocados based mainly on their own previous research
and experience (Embleton et al., 1958; Embleton et al., 1959 and
Embleton and Jones, 1964). They expressed their hope "...that presenting
these tentative guides will encourage more critical research on leaf analysis
standards for the avocado". However, very little improvement on these
norms has been proposed up to the present, although several researchers have
criticized the sample taken (Oppenheimer et al., 1961; Bergh, 1975 and
Lahav et al.. 1976). Gustafson (1981) was still advocating the exact
same sample and analysis norms for avocados in California as proposed some 1 5
years ago. Recently, Lahav et al. (1990) stressed the importance of
sampling leaves from the spring flush only, but concluded that there was no
basis to change the critical level of N in avocado leaves as proposed by
Embleton and Jones (1966). This level was 1.6% N for 'Fuerte' and 1.8% N for 'Hass'.
The purpose of this investigation was to evaluate the
sample and norms proposed by Embleton and Jones (1966) under South African conditions
and to obtain a more suitable sample, if necessary. This investigation was
carried out over several seasons at the Burgershall and Friedenheim
Experimental Stations near Nelspruit, Eastern Transvaal, South Africa.
Materials and Methods
Comparing different leaf samples and establishing the time of sampling. This experiment was carried out on the Burgershall
Research Station, 50 km north of Nelspruit. For this purpose 35 uniform,
healthy, five year old 'Fuerte1 trees on Edranol seedling rootstock
were selected. Spring flush branches were marked in August and rootstock were
selected. Spring flush branches were marked in August and 3 different leaves
were sampled monthly from September throughout the season until harvest. The
three samples (A, B and C) were differentiated as follows :
A - sampled according to Embleton
et al. (1958); this is spring cycle leaves, 5 to 7 months of age from
non-fruiting and non-flushing terminals
B - leaf at the position
shown in Fig. 1 from a non-fruiting branch showing no new flush at the time of
sampling
C - the youngest leaf at the
tip of a branch with new growth. This sample will always be less than two
months old.
Approximately
40 leaves were collected per sample per month and analyzed chemically.
Establishing analysis norms. Three
separate N, P and K fertilizer experiments with 8 levels of each element, 3
trees per plot and 3 replicates were laid out on 4-yr-old 'Fuerte' trees on
Duke seedling rootstock at Friedenheim Experimental Station. Data from 1982 to
1987 are presented. At the start of the experiment the soil had a pH (water) of
6.15 with a very low P status of 1 mg P/kg soil (resin extractable P); and 60
mg exchangeable K/kg soil. The levels of applied fertilizers are shown in Table
1. In the case of the N-experiment the levels of N were increased from 1985.
Leaf
samples B, (Fig. 1) were taken at the beginning of March (6- to 8-month-old
leaves). This sample was taken from the middle of the spring flush branches
containing no new growth at the time of sampling (Koen and du Plessis, 1991).
Results and Discussion
Comparing three different leaf samples. The effect of leaf age on the N, P and K
concentrations of the different samples are shown in Figs. 2, 3 and 4. As far
as N is concerned (Fig. 2), it is obvious that sample B shows a very stable
concentration range for 6- to 8-month-old leaves whereas both sample A and C
vary considerably during this period. For phosphorus (Fig. 3), sample B is also
constant for the 6 to 8 month period, whereas the other two are either
increasing or decreasing in P concentration. In the case of potassium (Fig. 4),
sample B is constant for the period 5 to 8 months, whereas A and C decrease
from 6 to 8 months of age.
From these results, it is obvious that the Embleton et
al. (1958) sample (A) shows too much variation during the 6-to 8-month-old
period, to be suitable for analysis purposes. Sample B as proposed by Koen and
Du Plessis (1991) is the most constant for N, P and K during that period. The
youngest leaf (sample C) is definitely not suitable for this purpose.
In
order to verify the suitability of a particular leaf for analysis purposes the
concentration of nutrients in that leaf should respond to changes in
fertilization and should also be related to yield (Langenegger and Du Plessis,
1977). The usefulness of sample B was thus further investigated in three
different fertilizer experiments.
Sensitivity of the leaf sample to changes in fertilizer applications. The effect of increasing the application rates of N,
P or K on the concentration of these elements in the leaves over four seasons
is shown in Table 2.
N-experiment: The leaf N concentrations were highly significantly
increased in all 4 seasons shown by increased rates of nitrogen.
P-experiment: Except for 1986, the leaf P concentrations were also
highly significantly increased by the increased P application rates.
K-experiment: As was the case in the N and P experiment, the
increased application of K caused a highly significant increase in the K
concentration of the leaves.
These
findings clearly demonstrated that by increasing fertilizer rates, the
concentration of the corresponding element in the leaves was significantly
increased. This was one of the prerequisites set by Langenegger and Du Plessis
(1977) for a leaf sample to be suitable for analysis purposes.
Relationship between leaf analysis and yield. Probably the most important characteristic of the
ideal sample for the purpose of leaf analysis is that a change in the
concentration of elements in the leaf should be reflected by a change in yield
(Langenegger and Du Plessis, 1977). In Table 3, the effect of increasing levels
of application of either N or P or K on yield is shown in the 3 different
experiments.
N-effect: N had the most
marked effect on yield of the three elements tested in these experiments. In
1983, the increased levels of N applied had a linear effect on yield, whereas
in 1985 and 1986, the effect was curvilinear reaching a maximum and declining
again with higher N rates (this decline was not significant). In the 1987
season, a maximum yield of 73 kg fruit/tree was obtained at the N$ level,
thereafter showing a slow but significant decline with higher N rates to a very
low yield of 15.2 kg fruit/tree.
P-effect: Only in the 1985
season did increased rates of P increase the yield significantly. Trends
were noticeable in the other seasons but were not significant.
K-effect: A significant
effect of K application on yield was only obtained in the 1983 season,
thereafter no clear cut trends emerged.
In
order to establish possible relationships between the leaf analysis of a
particular season and yield of that or the following season, regression
analyses were done using 24 data samples per season (8 treatments with 3
replicates). These data are shown in Figs. 5 to 8.
Leaf N and yield: A very
highly significant relationship existed in all 4 seasons between leaf N
concentration for that season and yield for the same season. In 3 of the 4
seasons, this relationship was improved upon by using leaf N data of the
current season to predict the yield in the following season. These
relationships were curvilinear in most cases.
Leaf P and yield: From these
data it is obvious that leaf P concentration in the current season only effects
the next season's yield significantly.
Leaf K and yield: A very poor
relationship was shown between leaf K concentration and yield. Only for one
season (1984) could the yield of the following season be predicted to a limited
extent.
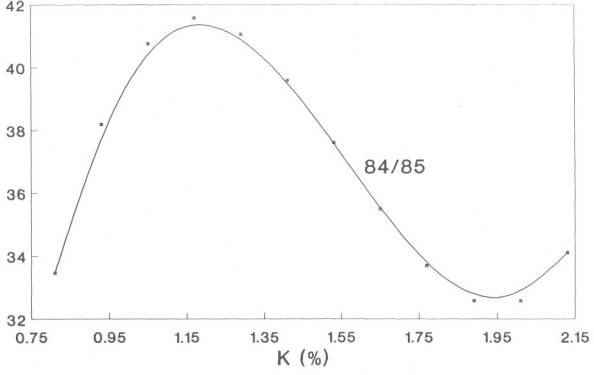
Leaf analysis norms. From the
graphs shown in Figs. 5 to 8, optimal concentration ranges were determined and
tabulated in Table 4. In the case of nitrogen the average optimal concentration
of 2.03 to 2.27 % can be used for either the yield of the sampling season or
the yield of the following season. In the case of P, only the yield of the next
season can be predicted. The adequate leaf P value seems to be higher than 0.17
% for two of the three seasons. In the case of potassium, only one season
(1984/85) showed an acceptable relationship between leaf K and yield, with an
optimal leaf K value of 0.93 to 1.41 % K.
Conclusions
The
results of this investigation show that the 6- to 8-month-old leaf sample
proposed by Koen and du Plessis (1991, Fig. 1) can be successfully used for
fertilizer recommendations for 'Fuerte' avocados. This sample is especially
suitable for nitrogen, but to a lesser extent also for phosphorus and
potassium. In the case of phosphorus, the present season's analysis figures are
only relevant to the next season's crop, whereas nitrogen is related to both
the present and subsequent season's crop. For nitrogen the optimal (adequate)
level ranges from 2.0 to 2.3 % N; for phosphorus, it should be higher than 0.17
% P; and for potassium between 0.9 and 1.4 % K.
Literature cited
Bergh, B.O. 1975. Avocado research in Israel.
Calif. Avocado Soc. Yrbk. 58:103-126.
Du Plessis, S.F. 1977. Soil analysis as a necessary
complement to leaf analysis for fertilizer advisory purposes. Proc. Int. Soc.
Citriculture 1:15-19.
Embleton, T.W. and W.W. Jones. 1964. Avocado
nutrition in California. Proc. Fla. State Hort. Soc. 77:401-405.
Embleton, T.W. and W.W. Jones. 1966. Avocado and
mango nutrition. Chap. 2. In: N.F. Childers, (ed.) Nutrition of Fruit Crops:
Tropical, subtropical, temperate trees and small fruits. Horticultural Publ.,
Rutgers - The State Univ., Rutgers, NJ.
Embleton, T.W., W.W. Jones, and M.J. Garber. 1959.
Curvilinear relationship between leaf nitrogen and yield of 'Fuerte' avocados.
Proc. Amer. Soc. Hort. Sci. 74:378-382.
Embleton, T.W., W.W. Jones, J.D. Kirkpatrick, and D.
Gregory-Allen. 1958. Influence of sampling date, season and fertilization on macronutrients
in 'Fuerte' avocado leaves. Proc. Amer. Soc. Hort. Sci. 72:309-320.
Gustafson, C.D. 1981. Leaf analysis, a valuable tool
when it comes to fertilization. Avocado Grower 8:14-16.
Koen, T.J. and S.F. Du Plessis. 1991. The
determination of the correct leaf sample and time of sampling of 'Fuerte'
avocados for the purpose of fertilizer recommendations. S. A. Avocado Growers'
Assn. Yrbk. 14:19-21.
Lahav, E., Y. Bar, and D. Kalmar. 1990. Effect of
nitrogenous fertilization on the annual variations in nutrients in avocado
leaves. Comm. in Soil Sci. and Plant Anal. 21:1353-1365.
Lahav, E., M.
Bareket, and D. Zamet. 1976. Potassium
fertilizer experiment with avocado trees on heavy soils. Calif. Avocado Soc.
Yrbk. 60:181-186.
Langenegger, W.
and S.F. Du Plessis. 1977. The
determination of the nutritional status of Dwarf Cavendish bananas in South
Africa. Fruits. 32:711- 724.
Oppenheimer, C.H., A. Kadman, and F. Radziszewska.
1961. Some observations on the nutritional status of avocado trees in Israel.
Calif. Avocado Soc. Yrbk. 45:81-85.
|
Table 1. Fertilizer levels
appliedz in the N, P and K fertilizer experiments (g/tree/annum). |
||||
|
Nutrient Level |
Experiment y |
|||
|
N |
N |
P |
K |
|
|
1982-1984 |
1985-1987 |
1982-1987 |
1982-1987 |
|
|
0 |
0 |
0 |
0.0 |
0 |
|
1 |
112 |
126 |
31.5 |
144 |
|
2 |
224 |
252 |
63.0 |
288 |
|
3 |
334 |
378 |
94.5 |
432 |
|
4 |
448 |
504 |
126.0 |
576 |
|
5 |
560 |
630 |
157.5 |
720 |
|
6 |
672 |
756 |
189.0 |
864 |
|
7 |
784 |
882 |
220.5 |
1008 |
|
z Time of application July: 1/3 N + 1/3 K; December: 1/3 N + 1/3 K + 1 P ; April: 1/3 N + 1/3 K. y N experiment received the P3 and K3 level; P-experiment
received the N3 and K3
level; K experiment received the N3 and P3 level. |
||||
|
Table 2. Effect of
increasing the level of application of N, P or K on the concentration of
these elements (%) in the B leaf over 4 seasons. |
||||||||||||
|
Nutrient Level |
N-experiment (%N) |
P-experiment (%P) |
K-experiment (%K) |
|||||||||
|
1984 |
1985 |
1986 |
1987 |
1984 |
1985 |
1986 |
1987 |
1984 |
1985 |
1986 |
1987 |
|
|
0 |
1.76 |
1.71 |
1.65 |
1.69 |
0.125 |
0.114 |
0.102 |
0.116 |
0.76 |
0.87 |
0.98 |
1.07 |
|
1 |
1.81 |
1.64 |
1.47 |
1.66 |
0.144 |
0.121 |
0.097 |
0.132 |
0.99 |
1.09 |
1.18 |
1.19 |
|
2 |
1.92 |
1.89 |
1.85 |
1.94 |
0.144 |
0.134 |
0.124 |
0.139 |
1.39 |
1.27 |
1.15 |
1.33 |
|
3 |
2.15 |
1.99 |
1.81 |
2.03 |
0.133 |
0.128 |
0.121 |
0.143 |
1.59 |
1.48 |
1.38 |
1.50 |
|
4 |
2.08 |
1.98 |
1.87 |
2.27 |
0.146 |
0.138 |
0.130 |
0.159 |
1.67 |
1.52 |
1.36 |
1.57 |
|
5 |
2.19 |
2.10 |
2.01 |
2.31 |
0.150 |
0.134 |
0.118 |
0.153 |
1.82 |
1.58 |
1.33 |
1.60 |
|
6 |
2.23 |
2.30 |
2.36 |
2.32 |
0.150 |
0.152 |
0.154 |
0.157 |
1.88 |
1.70 |
1.51 |
1.59 |
|
7 |
2.36 |
2.32 |
2.27 |
2.54 |
0.157 |
0.152 |
0.148 |
0.160 |
1.76 |
1.66 |
1.55 |
1.62 |
|
LSD |
|
|
|
|
|
|
|
|
|
|
|
|
|
P<0.05 |
0.25 |
0.23 |
0.38 |
0.28 |
0.013 |
0.019 |
0.034 |
0.016 |
0.35 |
0.21 |
0.25 |
0.17 |
|
P<0.01 |
0.35 |
0.32 |
0.53 |
0.39 |
0.018 |
0.026 |
- |
0.022 |
0.48 |
0.29 |
0.35 |
0.24 |
|
Table 3 - Effect of
increasing the level of application of N, P or K on yield (kg/tree) over 4
seasons. |
||||||||||||
|
Nutrient Level |
N-experiment (%N) |
P-experiment (%P) |
K-experiment (%K) |
|||||||||
|
1984 |
1985 |
1986 |
1987 |
1984 |
1985 |
1986 |
1987 |
1984 |
1985 |
1986 |
1987 |
|
|
0 |
0.5 |
2.6 |
0.4 |
9.8 |
4.2 |
28.2 |
13.5 |
51.9 |
2.1 |
39.3 |
21.9 |
42.0 |
|
1 |
1.0 |
7.5 |
2.7 |
33.9 |
3.9 |
40.9 |
25.3 |
45.3 |
2.2 |
22.1 |
16.3 |
32.1 |
|
2 |
3.6 |
21.4 |
14.2 |
51.2 |
4.8 |
40.8 |
28.6 |
50.9 |
4.0 |
37.9 |
31.9 |
56.9 |
|
3 |
4.9 |
42.7 |
25.9 |
73.0 |
2.9 |
39.8 |
30.9 |
58.9 |
8.1 |
34.1 |
19.4 |
45.5 |
|
4 |
8.7 |
32.5 |
20.2 |
52.6 |
2.7 |
39.3 |
26.3 |
62.2 |
2.1 |
24.0 |
18.9 |
31.3 |
|
5 |
10.5 |
39.5 |
27.9 |
47.0 |
5.3 |
45.6 |
27.6 |
60.3 |
6.7 |
40.9 |
33.2 |
55.2 |
|
6 |
18.6 |
40.5 |
17.2 |
39.2 |
7.5 |
50.5 |
30.2 |
63.4 |
2.2 |
36.2 |
31.1 |
43.7 |
|
7 |
22.3 |
35.8 |
19.0 |
15.2 |
9.4 |
60.7 |
29.9 |
67.6 |
2.4 |
33.7 |
28.2 |
38.1 |
|
LSD |
|
|
|
|
|
|
|
|
|
|
|
|
|
P<0.05 |
8.5 |
16.6 |
14.2 |
23.9 |
- |
17.9 |
- |
- |
3.5 |
- |
- |
- |
|
P<0.01 |
11.8 |
23.1 |
19.7 |
33.2 |
- |
- |
- |
- |
4.8 |
- |
- |
- |
Fig. 1 Position B indicates the leaf to be sampled from non-fruiting branches which are not showing signs of new flush.
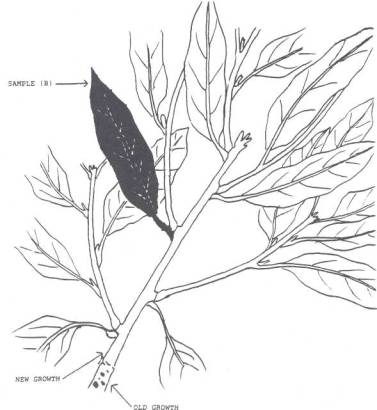
Fig. 2 The effect of leaf age on the N concentration of avocado leaves.
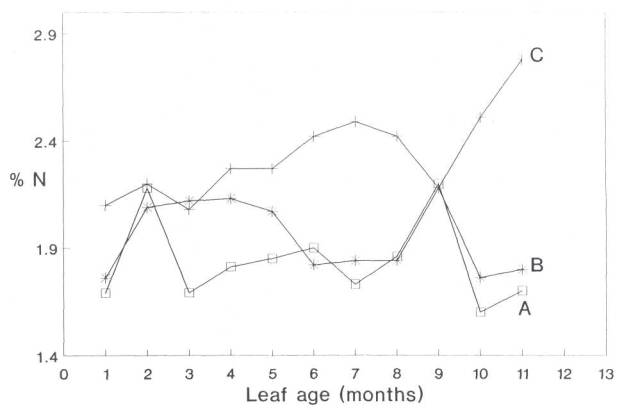
Fig. 3 The effect of leaf age on the P concentration
of avocado leaves.
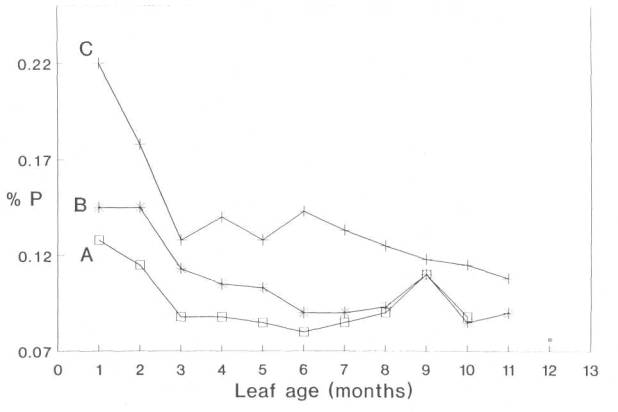
Fig. 4 The effect of leaf age on the K concentration
of avocado leaves.
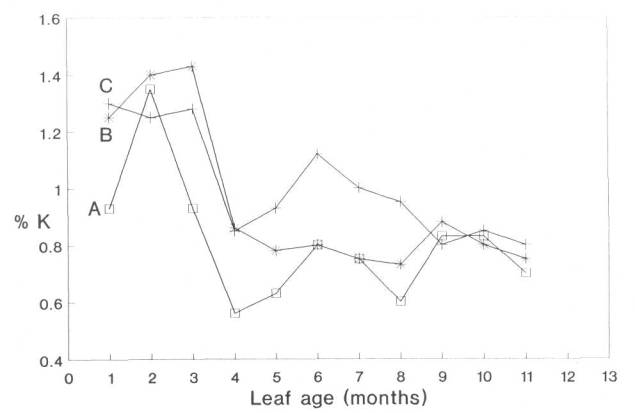
Fig. 5 Relationship between leaf N (x) of a particular
season and yield (kg/tree) (y) of the same season. (1983, R2 =0.69,
y = -58.15 + 34.03x; 1985, R2 =0.73, y = 1894.77 - 31 17.1 8x +
1676.51 x2 - 291.85x3; 1986, R2=0.51, y =
-399.31 + 393.89x -91.64x2; 1987, R2 = 0.71, y =
-530.18 + 564.24x - 135.78x2).
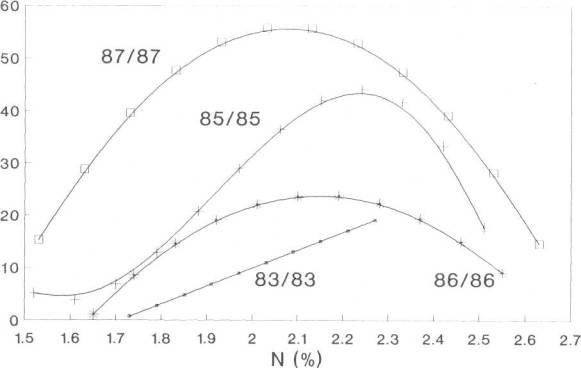
Fig. 6 Relationship between leaf N (x) of a particular
season and yield (kg/tree) (y) of the next season. (1984/1985, R2
=0.83, y = 4360.97 - 6914.69x + 3602.46x2 - 613.98x3; 1985/1986, R2=0.70,
y = 945.91 - 1607.1 3x + 890.32x2 . 159.29X3; 1986/1987, R2=0.58,
y = -472.51 + 510.56x - 124.49x2).
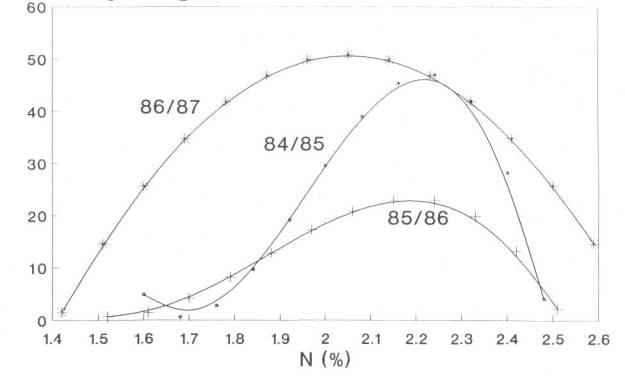
Fig. 7 Relationship between leaf P (x) of a
particular season and yield (kg/tree) (y) obtained the following season.
(1984/1985, R2 =0.62, y = 271.72 - 3869.3x + 15863.41x2;
1985/1986, R2=0.26, y = -157.34 + 2468.67x - 8107.85x2;
1986/1987, R2=0.43, y = 13.66 + 362.68x).
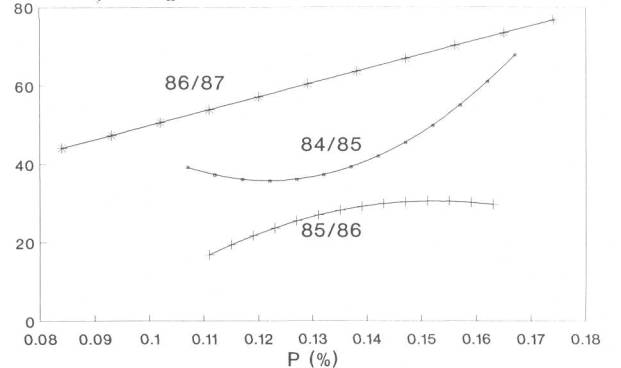
Fig. 8 Relationship between leaf K (x) in the 1984 season
and yield (kg/tree) (y) obtained in the 1985 season. (R2 =0.25, y =
-86.211 + 271.82x - 185.15x2 + 39.46x3).